some time ago I connected my firewall to a
board to see what kind of traffic I got peering into my server security…. mind you this is a very simple static web server for an inconsequent site…. this is the baseline, it is never 0 :|
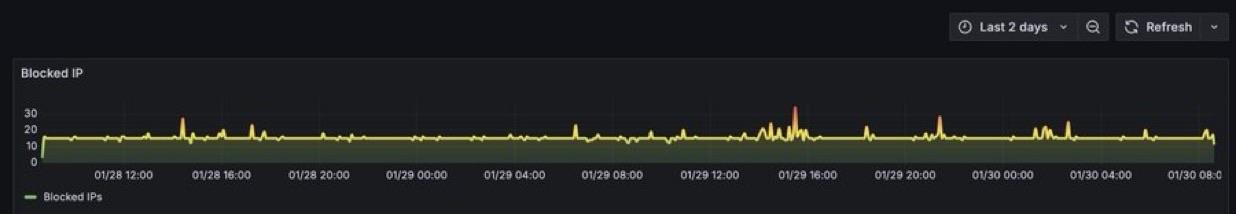
Line graph showing the number of blocked IP addresses over a two-day period. The Y-axis indicates the count of blocked IPs, while the X-axis represents time, with several peaks and troughs throughout the displayed timeframe.